Snapshot Analysis for C++
Snapshot Analysis for C++
Garbage collected languages like JavaScript offer developers a feature of Heap snapshots to analyze their memory problems. These memory problems are usually limited to high memory consumption as they can’t do pointer arithmetic.
A heap snapshot in C++ does not contain as much information as in garbage collected languages, we tend avoid using the heap for performance reasons. A full snapshot for a C++ program contains all the heaps, not just the main heap, all the stacks for all the threads, all the other memory we have mapped into the process. We have such snapshots, they are called memory dumps or core dumps or core files. We just can’t do anything with them besides opening them in a debugger and having a slightly worse experience than attaching the debugger directly to a live process. What if we could?
Here are some of the quesions that come up when debugging large enterprise applications written in C++:
- Are there any instances of
TheThing? The entire business logic depends on whetherTheThingexists. There is an event loop, all threads are either waiting for events or waiting for other threads or just waiting in generally (at least one of them will be busy spinning). I cannot tell from global or local variables whetherTheThingexists. According to the docs there should never be twoTheThings, again, there is no way to check. - How many
GargantuanGizmos do we have? They caused memory leaks in the past, and we have a memory leak now, but the GargantuanGizmo team says it’s not them it must be theEnormousEvents queuing up. - It would be nice if we could tell from the snapshot whether our memory consumption problems are memory leaks or memory ballooning. Mostly to avoid all the discussions speculating whether it is one or the other.
- Most parts of the code base deal with naked pointers, some part of the code base use
std::shared_ptrandstd::unique_ptrand there are at least ten different implementations of custom reference counting smart pointers. It is extremely unlikely that there are no cycles of reference-counted pointers. - There will always be someone blaming the memory consumption on memory fragmentation. Hard numbers on memory fragmentation could move the discussion back to more important topics, like the rampant memory corruption.
- The application crashes on shutdown. Sometimes it is an
abort(), astd::terminate()or an invalid memory access. Occasionally we get a clean exit. The team assumes that they only have messed up the order of their global variables’ destructors (again). Thus investigating has been put at the very end of thebackbuglog. - It could just as well be a corrupted data structure that will cause further undefined behavior on any access, and by shear luck it wasn’t accessed it until the global destructors started running.
It would be awesome if I could run a
fsckon all in-memory data structures - All teams compete to add the most features. Memory that you don’t use today will be used by someone else tomorrow. If we want to curb this waste we need to get a list of all in memory objects and figure out who is responsible for them.
- All of these problems are path dependent, they only happen when the application uses files from our customer, BigBucks.
- The files from BigBucks contain proprietary data of their customers, so they won’t share them with us.
- BigBucks is our largest customer with 100’000 installations. What our developers consider a rare bug happens 100’000x as often for our customers.
- Some of the problems only appear after the application has been running for fifteen days, which means reproduction is beyond the event horizon for teams working in two-week sprints.
Now, that purely hypothetical application is fucked beyond repair, but it turns out we can build the tools that answer all of these questions for applications that are disciplined in their use of modern C++.
Step 1: Object Discovery
Let’s try to get a list of all C++ objects in a core dump. The obvious starting point is to use debug information to find all global variables and their types. Let’s assume all global constructors have finished running and no global destructors have started running, that means all global variables are (supposed to be) in a valid state, we know their types and addresses.
Finding all local variables is a bit more involved as you have to do manual stack unwinding, but is doable in principle. Some those variables might be optimized away, but memory-owning objects like containers won’t be. If it has a non-trivial destructor there is good chance that it won’t be optimized away completely, sliced into discontinuous pieces, reside partially in registers or suffer from any of the other status effects an optimizing compiler could inflict. When I implemented this, the main problem was incomplete debug information:
- the debug information for aarch64 does not contain the locations of thread local variables
- the core dumps for i686 binaries do not contain enough information to recover the locations of thread local variables
- Debug information does not track lifetimes as accurately as it could. DWARF debug information is powerful enough to describe the location of a variable differently for every assembly instruction in a function (it might move from memory to a register, to a different register, back to memory but at a different address). This could be used to encode the lifetime of a local C++ variable in the debug information of its location, but no compiler makes use of it. So there might be local variables that haven’t been constructed or already been destroyed.
- My todo list includes checking whether this information is recoverable from line number information and exception unwinding tables.
Okay, that was the easy part, variables that we know about. This is a solved problem, today’s debuggers and tools can handle that. Now we need to use the variables to find objects in the heap(s).
Step 2: It’s actually impossible
We know what the situation would be like for a C program: we need to follow pointers. To find all objects we need to follow all pointers, recursively. Unfortunately, there are a couple problems with that approach:
- Pointers might not carry enough type information, particularly
voidpointers. - It is not encoded in the type system whether a pointer points to a single object or to an array of objects. If it does point to an array, the size of the array is no longer available.
- Pointers of multiple types might be aliased with each other or other data types in a
union. There is no way to tell which member is active from theunionalone. - A pointer might only point to a subobject to of a larger object. Or the only pointer to an array might point into the array, not at the beginning (so you can index with off-by-one errors and not get a crash just like BASIC or Matlab).
- But worst of all: A pointer might not point to an object at all, but to the end of an array.
In summary: pointers don’t work, unions don’t work.
Step 3: The solution is a layer of indirection
On the other hand, there are no raw pointers in modern C++ code. We use containers that encapsulate the messy memory management behind RAII.
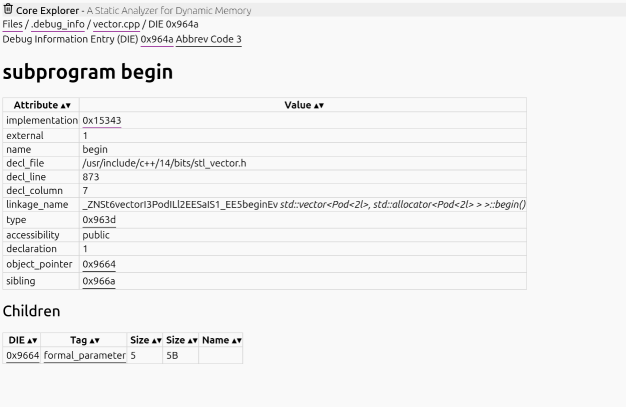
If we have a variable of type std::vector<T>, the debug information provides you with the following information:
- The type
Tof the contained elements, vector<T>hasbegin()andend()methods,- the addresses and mangled names of the functions implementing these methods,
- the iterator type that they return,
- the iterator type has
operator*()andoperator++,operator*()returnsT& - the addresses of the functions for these operators
- we can look up all of these functions in the binary and see their implementation in machine code
You can use the readelf tool with the option --debug-dump=info if you have not looked at raw DWARF debug information before
The following things work to our advantage:
- all containers in the standard libray provide this information,
- all containers from other libraries also adhere to this interface because it is required for ranged for loops,
- the iterators of standard libray containers are extremely simple, they usually just wrap one pointer,
- the
beginandendmethods are extremely simple, they usually return a private member variable of the container operator*()derefences the pointer, for node-based containers there might be an offset involvedoperator++will either increment the stored pointer (vector, string, span) or follow it to the next element (std::forward_list, std::list, sets and maps).
Here is the disassembly for std::vector::begin in an unoptimized build, an optimized build would inline the entire function into a single instruction

DWARF debug information has a powerful bytecode language to express computations, but it can only be used to desribe the location or value of variables, it cannot be used to tell a debugger what the effect of running a function would be.
In a live debugging session, the debugger can execute these functions in the running process, but there is no running process associated with a core dump. These functions are so simple that we can either recover the computation from machine code with a decompiler or write a very simple VM that executes the instructions for us.
I’ve created a proof of concept decompiler that can recover the computations from x86_64 assembly, I only needed to implement about 30 instructions out of the sprawling x86_64 instruction set. The instructions translate to an intermediate representation, I plan on adding an aarch64 backend next. Writing a decompiler was easier than I expected and is definitely easier than parsing C++.
Step 4: When to stop
It turned out that the hardest part was comparing iterators for equality (C++20 or later) or inequality (C++17 and earlier) to know when iteration should stop.
Because operator== is not member function, we need to search through all functions that we have debug information for and try to pick the right one.
In my prototype implementation I just pick the first comparison operator that accepts the right types and ignore ADL.
It is rare for people to define alternative comparisons for standard library iterators in other namespaces (custom comparsions for the containers themselves are more common).
So in summary:
- by combining debug information with decompilation or simulated execution we can discover the objects contained in standard library containers and all other containers that support ranged for loops
- this can be used by interactive debuggers to display the containers without having to write custom code for every container/debugger combination
- it can be used by other tools to discover all objects in a core dump
| Container | Iterator Advancement | Support |
|---|---|---|
| vector | pointer increment | yes |
| span | pointer increment | yes |
| string | pointer increment | yes |
| string_view | pointer increment | yes |
| array | pointer increment | not when it uses raw pointers instead of a proper iterator type |
| list | pointer dereference | yes |
| forward_list | pointer derefence | yes |
| unordered_set | pointer derefence | yes |
| unordered_map | pointer derefence | yes |
| deque | increment and/or derefence | yes |
| set | pointer chase | yes, but slow |
| map | pointer chase | yes, but slow |
Step 5: Everything else
Of course, there is more in the standard library and other libraries than just iterable containers, and there are no common interfaces.
Tagged Unions and Type Erasure
The contents of std::variant can be accessed with either holds_alternative/get or get_if and the totally radical will access them using just std::get and catch.
std::optional and std::expected can also be queried for their contents, but not with these methods.
std::any can be accessed with std::any_cast that has overloads for the std::get and std::get_if scenarios, but with a different name.
These standard library additions are all based on designs from boost, the boost implementations are still around but they use a different interface.
std::optional and std::expected are very useful, do not depend on language features more recent than C++11, but were added very late to the standard library.
There are tons of custom implementations of optional and expected in production code bases.
If we want our tools to be able to look into the contents of these types, then this puts a huge burden on the tools, leading to the status quo:
- debuggers have hand-written support for one standard library implementation, other tools (e.g. valgrind) are not container-aware at all
- containers from other libraries have no support in debuggers unless the library authors provide the necessary descriptions, which are debugger specific, and most libraries only come with support for one debugger. Other tools cannot be extended at all.
- Theoretically, I could use my prototype implementation to auto-generate pretty-printers for debuggers from the iterator computations that I lifted from machine code. I have not tried implementing that.
There are many custom variant-like types in production code bases, many less generic (a variant2<A,B>, a variant3<A,B,C>, …) or not templated at all.
I believe std::get_if is a good enough interface that could be supported by std::variant, expected, optional and any, and everyone else can also implement get_if in their namespace.
We haven’t mentioned the most type-erasing type of them all, std::function. It needs to accept and store any possible type that implements the corresponding function signature, so it needs to be as flexible std::any.
Unlike std::any there is no way at all to get the functor out again, so any tool has no option other than snooping the implementation.
Every standard library implementation has its own implementation, as well as boost and EASTL. There probably are a lot more, because it is a tempting target to implement a small buffer optimization to avoid the heap allocation.
| Container | Support |
|---|---|
| optional | yes |
| expected | yes (object and error object) |
| variant | only when the code uses get_if |
| any | no (requires strcmp which uses SIMD instructions) |
| function | not (no public interface to get contained object) |
Smart Pointers
The standard library has std::shared_ptr and std::unique_ptr, boost has shared_ptr and scoped_ptr and intrusive reference counting, many code bases have their own.
The good thing about smart pointers is that they either point to a valid object or they are null.
I was a bit surprised when I realized there is no good way to figure out whether something is a smart pointer as they share their pointer-like interface with iterators and optional.
I’ve settled on determining a smart pointer by:
- the combination of
operator*()andget()methods to dereference, they must return a reference - an
operator bool()to test for emptiness
This excludes iterators as well as std::optional and std::expected, which use a value() method instead of get().
| Container | Support |
|---|---|
| shared_ptr | yes |
| unique_ptr | yes |
I haven’t started yet, but now that I have written my own decompiler and defined a concept for smart pointers and containers, I want to use the logic in the destructor to see whether it is possible to classify them into:
- non-owning (does not call destructor for contained objects),
- shared ownership (may call the destructor if certain conditions are fulfilled)
- unique ownership (unconditionally calls destructor, except for an empty check).
This would enable more checks that can be run, e.g. typical problems with smart pointers (when constructed from raw pointers) are a smart pointer for constant data or objects on the stack (detect now that there will be double-free in the future) or comparing the reference count to the number of reference counting pointers.
One of the primary uses of smart pointers is for object oriented programming. We have a factory that creates an object for us,
we only know its interface but not the concrete class. It will be destroyed by invoking its virtual destructor.
How can we get the concrete type of the object? By using its RTTI data just like dynamic_cast would.
However, as a coredump analyzer or debugger we have full information about the process and can spend more time searching for answers.
If the application has disabled RTTI, we can still recover the type of every object with virtual functions by following the vtable pointer into a binary in the process and looking up the address in its symbol table.
In fact, we can search for vtable pointers in memory regions for which we have no information otherwise. I have found that checking every properly aligned 64-bit value against all vtable addresses in the process is a very good heuristic with essentially no false positives (once you account for multiple inheritance).
If you have a memory leak due to a cycle of reference-counted pointers and at least one object in the cycle has a virtual function, you can recover its actual type, and therefore follow its member variables to discover all other objects in the cycle.
If no objects have virtual methods, but one of the pointers is managed by a std::shared_ptr (or another smart pointer with a similar implementation),
then the control block of the smart pointer has a virtual destructor and can therefore be used to recover the type information.
Leaving the Ivory Tower
In summary, for an application, that…
- has very good and very complete debug information,
- only uses instructions implemented by our decompiler/emulator,
- only uses standard library containers or other RAII containers with similar interfaces,
we can discover all C++ objects with perfect type information starting from global and local (and thread local) variables by following all supported containers and smart pointers.
Which is very cool but also pretty pointless, because nothing of interest satisfies those requirements.
For release binaries, all the begin() and end() methods and all get_if functions will be inlined, preventing the recovery of their definition.
Release binaries will use all optimizations and all instructions available to them.
The reason we are doing analysis on a coredump in the first place is because we cannot run the application through valgrind or heaptrack or with address sanitizer.
The application might be using modern C++ in some places, and the standard library in some other places, but there will be many custom classes with plenty of quirks.
There is one solution to all of this:
Sideloading Debug Binaries
- We have a coredump for a release binary
- We cannot decompile the methods needed to inspect containers because they have been inlined
- Debug information does contain the mangled name of the methods we need
- There was a debug build created at the same time with the same sources
- The stdlibc++ and libc++ libraries are binary compatible between release builds and debug builds and across all variations of hardening
- Current debuggers and tools load all binaries contained in a core dump and their debug information and then stop. But we can just load more.
- We can look up the methods we need in the debug binaries, decompile them from there and apply them in the core dump from the release binary
- Create a new binary, a unit test for example, that implements a templated, free-standing
get_ifmethod for CrappyTaggedUnion and free-standingbeginandendfor WeirdSparseContainer - Load a debug build for the binary and now the tool understands CrappyTaggedUnion and WeirdSparseContainer
- We have effectively turned machine code+debug information into a tooling extension language for role the currently filled by Python pretty printers and Natvis XML.
- Which would be horrible to write by hand, but our favorite compilers can generate it for us from C++ code.
Sideloading binaries only works if we have a reliable check for ODR violations. A reliable check for ODR violations across shared libraries is a good thing in general, it would make a lot of sense if today’s debuggers offered that. It will help detect some bugs that would be very hard to diagnose otherwise and it can also be used to detect malicious ODR violations like the function hijacking done by the xzutils-backdoor.
Needles and haystacks
For a large application, a list of all C++ objects will be one thing: long. There are probably several static analyzers that have been run on the code base, in addition to all the compiler warnings that have been ignored. What can we do with a list of all objects and their types beside adding to the noise? We can check their invariants. Contracts won’t arrive until C++26, and when they arrive, they will not cover class invariants. But there are still some invariants we can check:
- Every pointer (the raw pointers inside our objects) must be properly aligned and point to an object, the end of an array, or be the nullptr.
- In particular, if it is not null then it must point into the applications virtual address space and not into freed memory.
- Vtable pointers must also point to valid vtable addresses of a compatible type
- Function pointers must point at actual functions
When we run these checks we can detect latent memory corruption, invalid object states only reachable via undefined behavior like use-after-free, race conditions or out-of-bounds reads or writes.
When I am debugging a hard to reproduce bug, I need multiple triggers for a complete reproduction:
- the unknown trigger for the root cause needs to happen, causing some invalid state in the application
- as developer, I do not know when this has happened, I need to trigger an observable consequence in addition to the root cause. This is usually a crash due to invalid memory access or an abort from checked functions.
- There might be several intermediate steps involved that propagate invalid data but will not crash themselves
- There is now an automated way to search memory snapshots for evidence of memory corruption
- We can also search for evidence of type confusion, which happens when pointers of different types point to the same memory area.
- We can search for use-after-free hazards, when objects on the heap or in other threads’ stacks point to an object on the current thread’s stack
- We can define our own methods to implement checks for invariants, even if the standard does not provide them
I see plenty of potential when combined with another feature that is also not commonly implemented despite being technically feasible:
Allocation discovery
Using the debug information of the C library and malloc implementation, it is possible to create a list of all used and free allocations in a core dump. By itself, this can tell us how fragmented our memory allocations are. If we use the heuristic used by conservative garbage collectors that every value that looks like a pointer is a pointer, then:
- We can run conservative leak detection and find all allocations that are unreachable from global, local and thread local variables.
- We can look at pointers between those allocations and differentiate between direct and indirect leaks.
- With the techniques mentioned in the section smart pointers, we might be able to recover the type of the leaked objects. I find it important to distinguish between leaked objects and leaked allocations, a single allocation can hold several objects.
- We can also search for pointers between reachable allocations, thereby turning them into a directed graph. We can then search this graph for the nodes with the highest weight, counting outgoing edges or counting outgoing edges weighted by allocation size.
- These are the allocations responsible for most memory allocations or most memory.
- We can combine this information with our list of objects and see which types of objects are responsible for these allocations.
- As mentioned before, we can search for pointers into freed allocations to detect memory errors.
- We can also perform the checks on allocation metadata malloc would perform upon
free()to detect evidence of memory corruption - I don’t think we can reliably distinguish between owning and non-owning pointers at the moment, but that is an avenue worth exploring.
I have implemented allocation recovery for GNU libc malloc used on GNU/Linux, the next malloc implementation I want to look at is jemalloc, which is used by FreeBSD but also as a standalone malloc implementation.
My current implementation can find memory leaks for objects that are truly unreachable, but it does not yet identify connected components that are unreachable from local and global variables. I only check for what valgrind considers definite memory leaks, there is also the concept of possible memory leaks, which is when there is no pointer to the beginning of an allocation, but there still are pointers into the allocation with a non-zero offset.
There is also a lot of information that can be used when comparing two snapshots of the same process:
- Did the number of allocations or objects go up? Is it limited to a particular allocation size or type?
- Did the number of leaked allocations or objects go up?
- Which types have the most allocation churn (different addresses than previous snapshot)
- If we see an allocation change from used to leaked, we may find the last owner and the type of content.
The current implementation can be found as a standalone nodejs binary cdx.js at https://github.com/core-explorer/core-explorer/ or you can run it in your browser without download at https://core-explorer.github.io/core-explorer/.
I have example core dumps at https://github.com/core-explorer/binary-samples
- Invalid pointer derefence
- Calling a virtual function from a base class
- leaking memory
- Corrupting malloc metadata
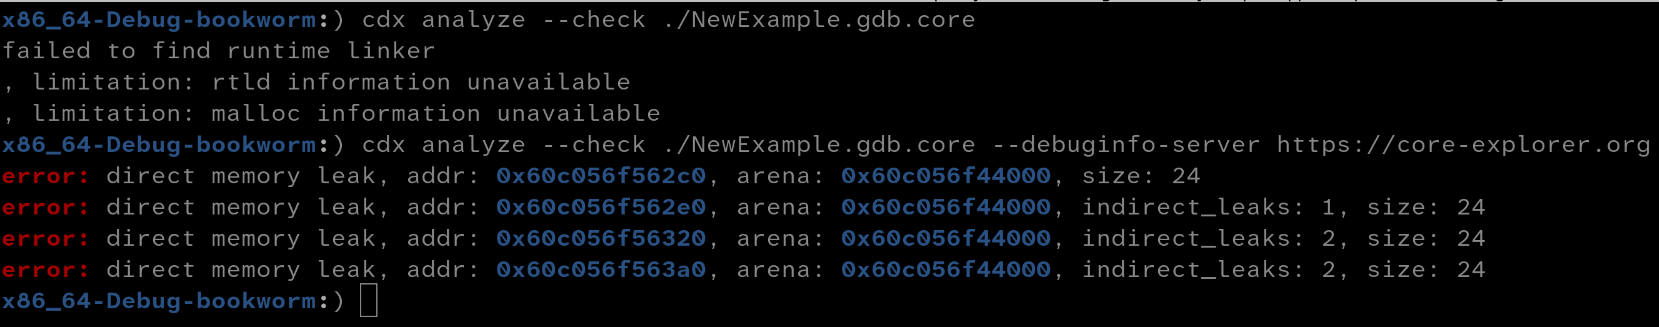
If you build the examples yourself and have debug information for the C runtime library installed locally, analysis should just work. If you check out the pre-built examples, your experience will look like this
Analysis requires binaries and debug information for all executables and shared libraries used in the core dump. You need to either specify a sysroot (with --sysroot) or a debuginfod server with (--debuginfo-server) so that the tool can find the missing information.
Debian, Ubuntu and Fedora all run public debuginfod servers, and the elfutils project runs a debuginfod server at https://debuginfod.elfutils.org that will resolve to these as needed and can serve you debug information for all pre-built binaries from these distributions.
It will not serve the binaries themselves though. The information necessary for stack unwinding is contained in binaries not in debug information so it is really necessary to have the binaries as well as the debug information (in addition to needing them for decompiling or emulating functions).
For that reason I run a custom debuginfod server at https://core-explorer.org that I stuffed with the glibc binaries needed for the analysis of my pre-built examples.